Lyme Disease
Health
Disease
This indicator tracks the rate of reported Lyme disease cases across the United States.
Figures
Figure 1. Reported Cases of Lyme Disease in the United States, 1992–2022
Data source: Centers for Disease Control and Prevention, 2024
Web update: December 2024
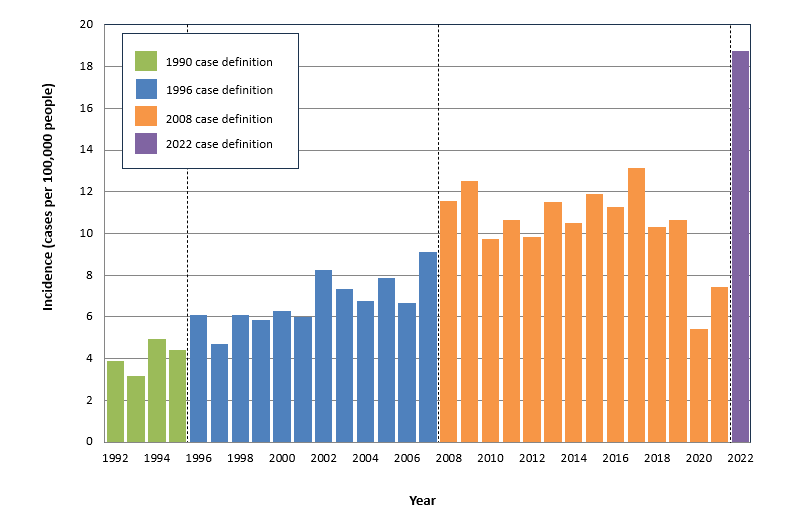
This graph shows the annual incidence of Lyme disease, which is calculated as the number of cases per 100,000 people. The graph is based on cases that local and state health departments report to CDC’s national disease tracking system. Due to the COVID-19 pandemic, 2019 and 2020 data from some jurisdictions are incomplete.
The line breaks at each of the three points where the surveillance case definition changed, in 1996, 2008 and 2022, dividing the record into four segments. Values are not comparable across a break: the apparent jump in 2022 is largely the result of the new definition letting high-incidence jurisdictions report on laboratory evidence alone, rather than a change in disease risk. Hover any point for that year’s value and for the caveat CDC or EPA attaches to it.
Data source: CDC, 20248
Show the data behind this figure
| Year | Case definition | Cases per 100,000 people | Note (EPA / CDC) |
|---|---|---|---|
| 1992 | 1990 case definition | 3.863 | |
| 1993 | 1990 case definition | 3.177 | |
| 1994 | 1990 case definition | 4.957 | |
| 1995 | 1990 case definition | 4.394 | |
| 1996 | 1996 case definition | 6.108 | |
| 1997 | 1996 case definition | 4.695 | |
| 1998 | 1996 case definition | 6.091 | |
| 1999 | 1996 case definition | 5.832 | |
| 2000 | 1996 case definition | 6.284 | |
| 2001 | 1996 case definition | 5.976 | |
| 2002 | 1996 case definition | 8.262 | |
| 2003 | 1996 case definition | 7.333 | |
| 2004 | 1996 case definition | 6.764 | |
| 2005 | 1996 case definition | 7.886 | |
| 2006 | 1996 case definition | 6.680 | |
| 2007 | 1996 case definition | 9.111 | |
| 2008 | 2008 case definition | 11.575 | |
| 2009 | 2008 case definition | 12.540 | |
| 2010 | 2008 case definition | 9.750 | |
| 2011 | 2008 case definition | 10.623 | |
| 2012 | 2008 case definition | 9.824 | |
| 2013 | 2008 case definition | 11.490 | |
| 2014 | 2008 case definition | 10.512 | |
| 2015 | 2008 case definition | 11.873 | |
| 2016 | 2008 case definition | 11.280 | |
| 2017 | 2008 case definition | 13.152 | |
| 2018 | 2008 case definition | 10.305 | |
| 2019 | 2008 case definition | 10.646 | Data from some jurisdictions are incomplete for this year because of the COVID-19 pandemic. |
| 2020 | 2008 case definition | 5.429 | Data from some jurisdictions are incomplete for this year because of the COVID-19 pandemic. |
| 2021 | 2008 case definition | 7.412 | State and local health departments reported fewer cases of Lyme disease in 2020 and 2021, which likely reflects the impacts of the COVID-19 pandemic rather than a true change in disease risk. |
| 2022 | 2022 case definition | 18.769 |
Figure 2. Reported Annual Lyme Disease Incidence in the United States, 2022
Data source: Centers for Disease Control and Prevention, 2024
Web update: December 2024
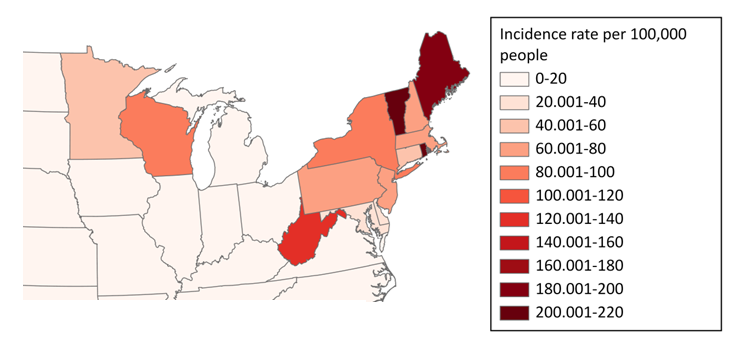
This chart shows reported Lyme disease incidence by jurisdiction in 2022, based on the number of total cases per 100,000 people, ranked from highest to lowest. The dotted rule marks 10 cases per 100,000 people: the jurisdictions above it are the 15 states and the District of Columbia that CDC designates “high-incidence.”
EPA presents this figure as a map, shading only the part of the country where Lyme disease is common — every state below 10 cases per 100,000 people is left uncoloured, and the shaded ones are read off an 11-step colour scale. All 51 jurisdictions are charted here instead, with their actual values, which also keeps apart two things the map cannot: Oklahoma reported a genuine zero, while Hawaii filed no report at all. EPA’s own map is available as a download above.
Data source: CDC, 20248
Show the data behind this figure
| Jurisdiction | Cases per 100,000 people |
|---|---|
| Rhode Island | 212.6 |
| Vermont | 202.7 |
| Maine | 191.0 |
| West Virginia | 139.2 |
| Wisconsin | 88.4 |
| New York | 85.4 |
| New Hampshire | 77.6 |
| Massachusetts | 72.3 |
| Pennsylvania | 64.9 |
| New Jersey | 63.7 |
| Connecticut | 56.0 |
| Minnesota | 47.0 |
| Maryland | 33.0 |
| Delaware | 29.2 |
| Virginia | 16.2 |
| District of Columbia | 11.5 |
| Michigan | 5.6 |
| Iowa | 4.8 |
| Ohio | 4.7 |
| Indiana | 3.5 |
| North Dakota | 2.8 |
| North Carolina | 2.6 |
| Illinois | 2.1 |
| Kentucky | 1.6 |
| Oregon | 1.4 |
| South Dakota | 1.3 |
| Montana | 1.2 |
| Florida | 1.0 |
| Alaska | 1.0 |
| South Carolina | 0.8 |
| Wyoming | 0.7 |
| Alabama | 0.6 |
| Idaho | 0.5 |
| Utah | 0.5 |
| Nebraska | 0.5 |
| Tennessee | 0.5 |
| Nevada | 0.3 |
| Kansas | 0.3 |
| Washington | 0.3 |
| Georgia | 0.3 |
| California | 0.2 |
| Colorado | 0.2 |
| New Mexico | 0.1 |
| Arizona | 0.1 |
| Missouri | 0.1 |
| Louisiana | 0.1 |
| Mississippi | 0.1 |
| Texas | 0.1 |
| Arkansas | 0.1 |
| Oklahoma | 0.0 |
| Hawaii | not reported |
Figure 3. Change in Incidence and Distribution of Reported Cases of Lyme Disease in the United States, 1996 and 2022
Data source: CDC, 20249
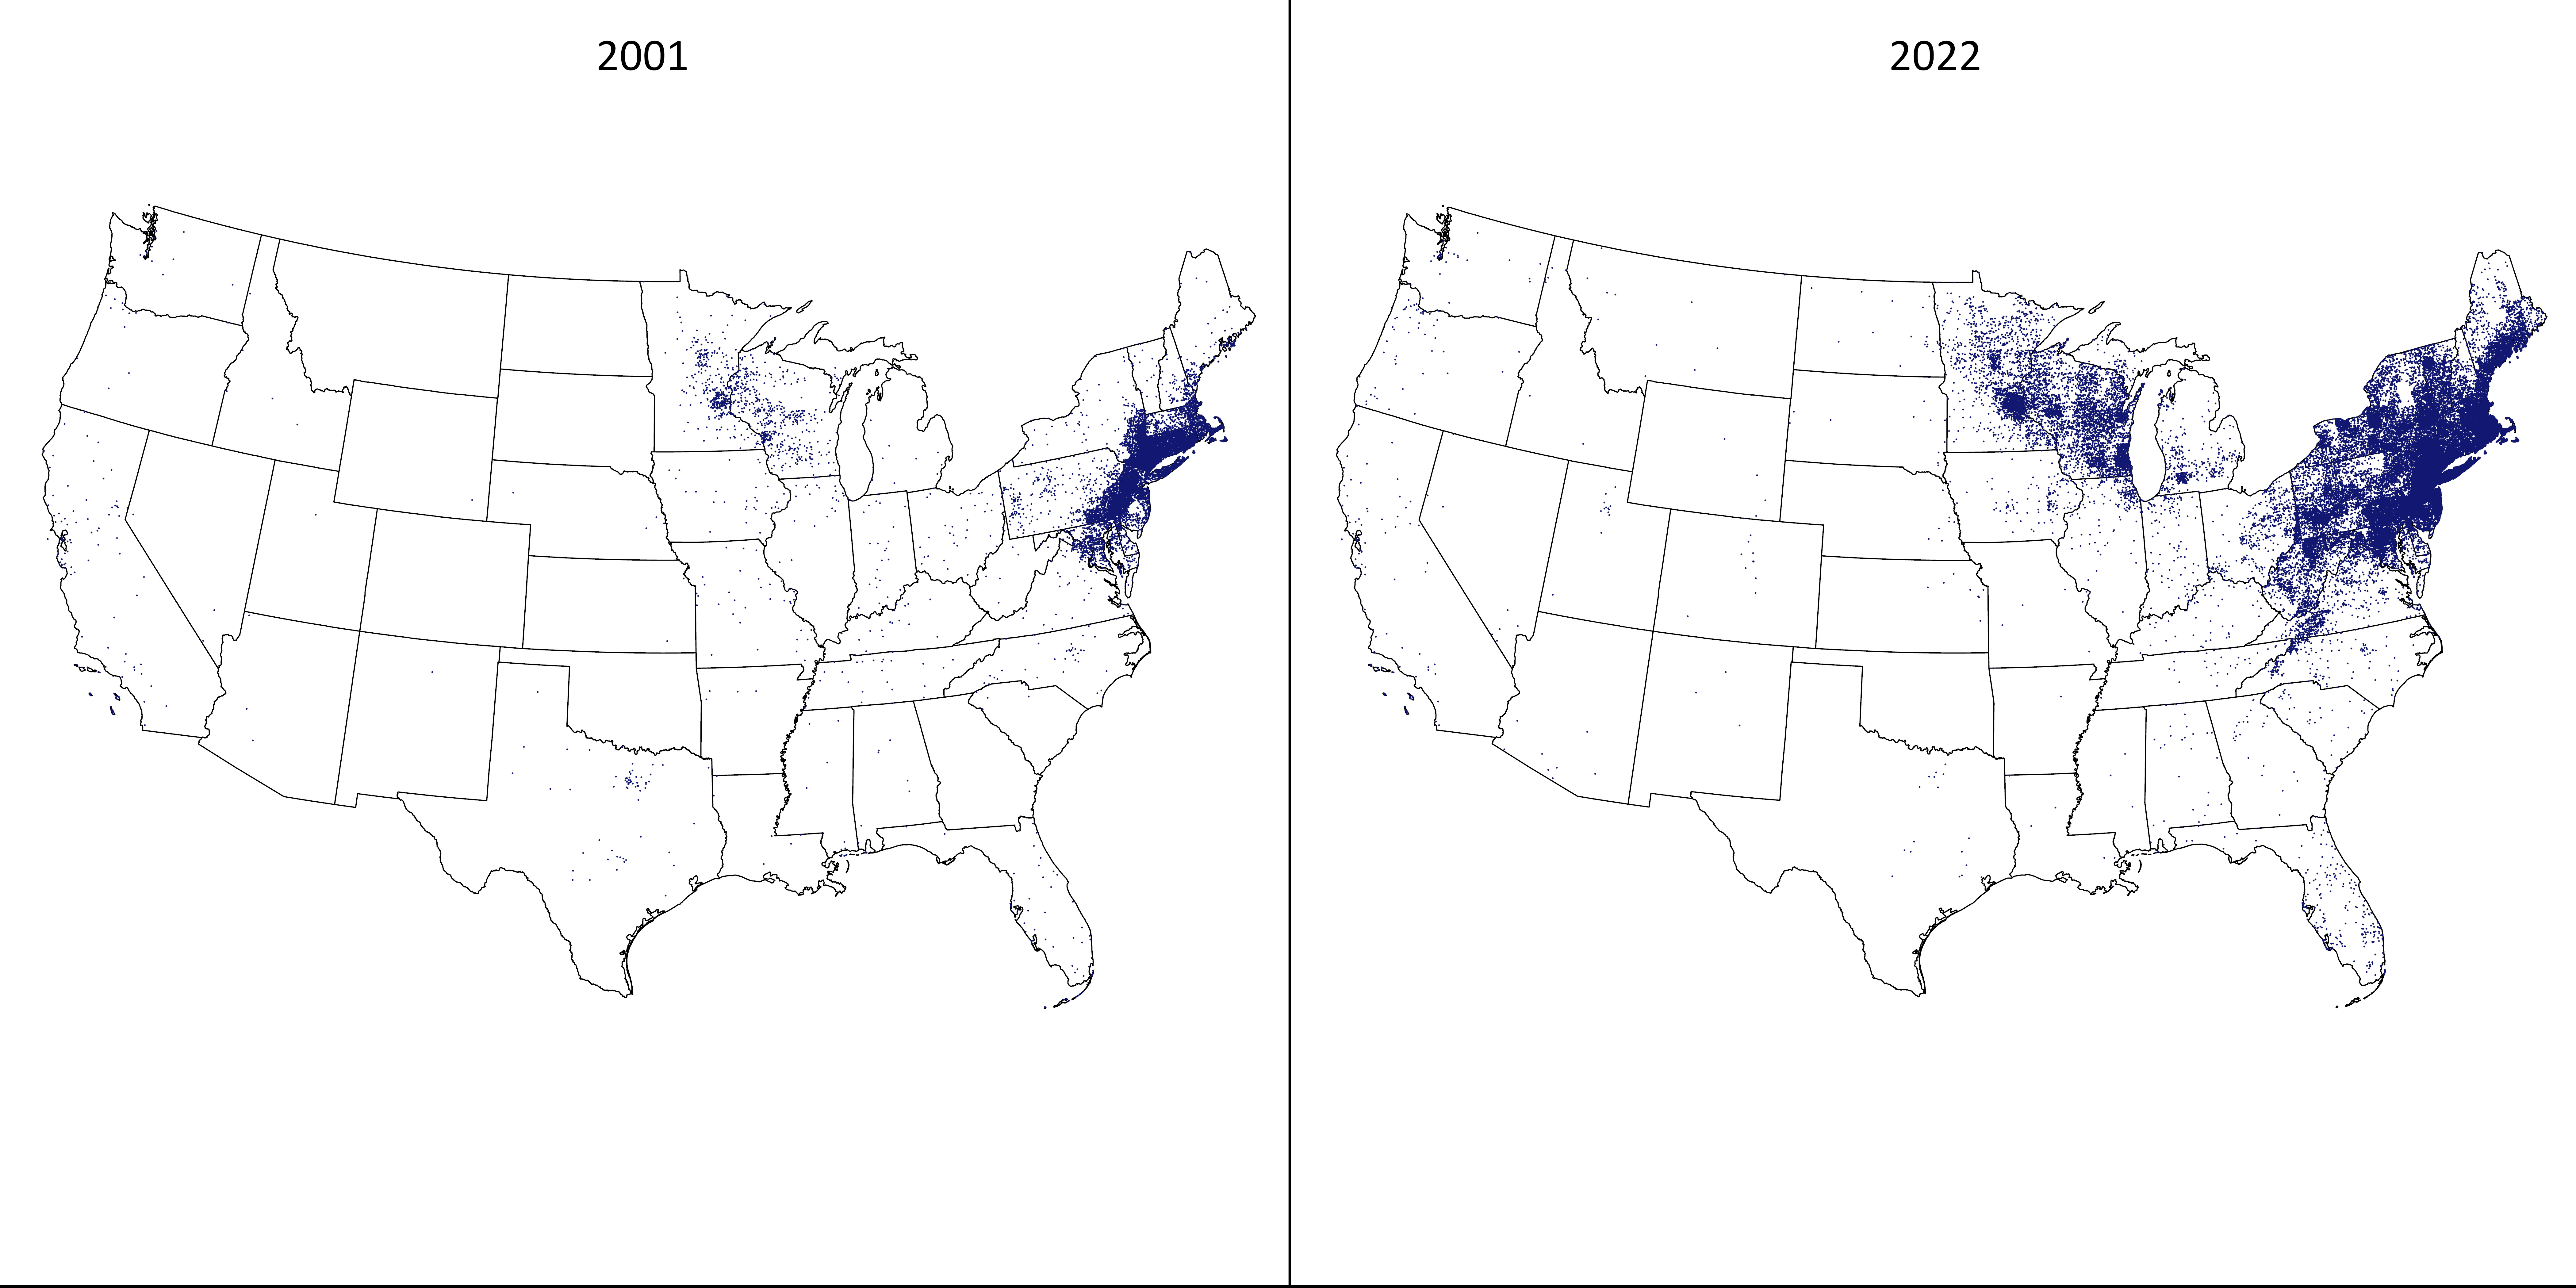
These maps show the distribution of Lyme disease cases reported to CDC in 1996 and 2022 across the 50 states and the District of Columbia. Each dot represents an individual case. Dots are placed randomly within each patient’s county of residence, which might differ from the county where they were exposed. The year 1996 was chosen as the first year after a major case definition update that incorporated standardized testing approaches.
EPA publishes these maps as images only, with no underlying data file, so there is no data table for this figure.
Key Points
- Between 1992 and 2022, the incidence of Lyme disease in the United States has ranged from a minimum of 3.2 reported cases per 100,000 people in 1993 to a maximum of 18.8 per 100,000 people in 2022 (Figure 1). Changes in the way Lyme disease cases have been defined and reported over time make it challenging to identify long-term trends.
- Lyme disease is much more common in the Northeast, mid-Atlantic, and upper Midwest than in other regions (Figure 2). The CDC has identified 15 states and the District of Columbia as “high-incidence jurisdictions” where Lyme disease cases consistently occur at a high rate. These states plus D.C. accounted for about 95 percent of the nation’s reported Lyme disease cases in 2022.
- Driven by multiple factors, the distribution of reported cases of Lyme disease has expanded over time (Figure 3).
Background
Lyme disease is a bacterial illness that can cause fever, fatigue, joint pain, and skin rash, as well as more serious joint and nervous system complications. Lyme disease is the most common vector-borne disease (that is, a disease transmitted by mosquitoes, ticks, or fleas) in the United States.1,2 Lyme disease is transmitted through the bite of certain species of infected ticks (referred to commonly as deer ticks) that carry the bacteria that cause Lyme disease. These ticks live not only on deer, but also on rodents, birds, and other host animals. Deer do not harbor the bacteria that cause Lyme disease, but certain other hosts such as white-footed mice do, and ticks pick up the bacteria by feeding on these infected hosts.
Studies provide evidence that climate change has contributed to the expanded range of ticks,3 increasing the potential risk of Lyme disease, such as in areas of Canada where the ticks were previously unable to survive. The life cycle and prevalence of deer ticks are strongly influenced by temperature.3,4 For example, deer ticks are mostly active when temperatures are above 45˚F, and they thrive in areas with at least 85-percent humidity. Thus, warming temperatures associated with climate change are projected to increase the range of suitable tick habitat and are, therefore, one of multiple factors driving the observed spread of Lyme disease.3 Because tick activity depends on temperatures being above a certain minimum, shorter winters could also extend the period when ticks are active each year, increasing the time that humans could be exposed to Lyme disease. Unlike some other vector-borne diseases, tick-borne disease patterns are generally less influenced by short-term changes in weather (weeks to months) than by longer-term climate change.
Climate is just one of many important factors that influence the transmission, distribution, and incidence of Lyme disease. Other factors that affect the number of Lyme disease cases include changes in the populations of host species (particularly deer), which affect tick population size. The percentage of ticks that are infected depends on the prevalence and infection rates of white-footed mice and certain other hosts. Host species populations and habitats can be affected by climate change and other ecosystem disturbances. Human exposure to infected ticks is also influenced by factors such as changes in the proximity of human populations to ticks and other hosts, increased awareness of Lyme disease, and modified behaviors, such as spending less time outdoors, taking precautions against being bitten, and checking more carefully for ticks. Occupation influences exposure, as people who work outdoors, like farmers and landscapers, may be especially at risk.5 Lyme disease is one of many diseases transmitted to humans by ticks or mosquitoes that CDC tracks.1
About the Indicator
This indicator looks at the incidence of Lyme disease, which reflects the rate of new cases reported in a given geographic area and time period. Incidence is typically calculated as the number of cases per 100,000 people per year. Annual Lyme disease totals and rates reported for each state were provided by CDC. The original data were collected by state and local health departments, which track cases of Lyme disease and report these cases to the National Notifiable Diseases Surveillance System. Nationwide reporting of Lyme disease began in 1991, and 1992 was the first year with complete national data. However, the actual number of illnesses is likely greater than what is reported to health officials.6,7
Figure 1 shows the reported national incidence of Lyme disease since 1992, and Figure 2 shows incidence by state for the most recent year with data (2022). To illustrate changes in the distribution of reported cases over time, Figure 3 presents side-by-side maps that compare 2022 with 1996, which was the first year with readily available case numbers by county.
Indicator Notes
Changes in diagnosing practices and awareness of the disease over time can affect Lyme disease trends. Cases are reported based on the patient’s county of residence, which is not necessarily the place where they were infected. Risk of infection is focused in certain regions of the country, and confirmed reports from areas with low incidence are often the result of travel to an area of higher incidence. Evidence suggests that expanding ranges of ticks in certain northern states may be more related to a warming climate than expanding ranges in southern states.10,11 Because of the many factors affecting tick populations and reporting of Lyme disease, though, this indicator does not provide sufficient information to determine what proportion of the observed changes in Lyme disease incidence is directly driven by climate change. Further study is critical to improving the usefulness of this indicator and informing decisions affecting public health. For information on prevention, symptoms, and treatment of Lyme disease, see: www.cdc.gov/lyme.
Data Sources
All three figures are based on publicly available Lyme disease data compiled by CDC at: www.cdc.gov/lyme/data-research/facts-stats/surveillance-data-1.html. Incidence was calculated using mid-year population estimates from the U.S. Census Bureau.12
Technical Documentation
References
- Rosenberg, R., Lindsey, N., Fischer, M., Gregory, C., Hinckley, A., Mead, P., Paz-Bailey, G., Waterman, S., Drexler, N., Kersh, G., Hooks, H., Partridge, S., Visser, S., Beard, C., & Petersen, L. (2018). Vital signs: Trends in reported vectorborne disease cases—United States and territories, 2004–2016. Morbidity and Mortality Weekly Report, 67(17), 496–501. https://doi.org/10.15585/mmwr.mm6717e1
- Schwartz, A. M., Hinckley, A. F., Mead, P. S., Hook, S. A., & Kugeler, K. J. (2017). Surveillance for Lyme disease—United States, 2008–2015. MMWR. Surveillance Summaries, 66(22), 1–12. https://doi.org/10.15585/mmwr.ss6622a1
- Beard, C. B., Eisen, R. J., Barker, C. M., Garofalo, J. F., Hahn, M., Hayden, M., Monaghan, A. J., Ogden, N. H., & Schramm, P. J. (2016). Chapter 5: Vectorborne diseases. In USGCRP (U.S. Global Change Research Program), The impacts of climate change on human health in the United States: A scientific assessment. https://health2016.globalchange.gov/vectorborne-diseases
- Leighton, P. A., Koffi, J. K., Pelcat, Y., Lindsay, L. R., & Ogden, N. H. (2012). Predicting the speed of tick invasion: An empirical model of range expansion for the Lyme disease vector Ixodes scapularis in Canada. Journal of Applied Ecology, 49(2), 457–464. https://doi.org/10.1111/j.1365-2664.2012.02112.x
- Gamble, J. L., Balbus, J., Berger, M., Bouye, K., Campbell, V., Chief, K., Conlon, K., Crimmins, A., Flanagan, B., Gonzalez-Maddux, C., Hallisey, E., Hutchins, S., Jantarasami, L., Khoury, S., Kiefer, M., Kolling, J., Lynn, K., Manangan, A., McDonald, M., … Wolkin, A. F. (2016). Chapter 9: Populations of concern. In USGCRP (U.S. Global Change Research Program), The impacts of climate change on human health in the United States: A scientific assessment (pp. 247–286). https://doi.org/10.7930/J0Q81B0T
- CDC (U.S. Centers for Disease Control and Prevention). (2013). CDC provides estimate of Americans diagnosed with Lyme disease each year [Press release]. https://archive.cdc.gov/#/details?url=https://www.cdc.gov/media/releases/2013/p0819-lyme-disease.html
- CDC (U.S. Centers for Disease Control and Prevention). (2024). Lyme disease surveillance and data. Retrieved July 31, 2024, from www.cdc.gov/lyme/data-research/facts-stats/index.html
- CDC (U.S. Centers for Disease Control and Prevention). (2024). Lyme disease surveillance data. Retrieved July 31, 2024, from www.cdc.gov/lyme/data-research/facts-stats/surveillance-data-1.html
- CDC (U.S. Centers for Disease Control and Prevention). (2024). Lyme disease case map. Retrieved July 31, 2024, from www.cdc.gov/lyme/data-research/facts-stats/lyme-disease-case-map.html
- Diuk-Wasser, M. A., Hoen, A. G., Cislo, P., Brinkerhoff, R., Hamer, S. A., Rowland, M., Cortinas, R., Vourc’h, G., Melton, F., Hickling, G. J., Tsao, J. I., Bunikis, J., Barbour, A. G., Kitron, U., Piesman, J., & Fish, D. (2012). Human risk of infection with Borrelia burgdorferi, the Lyme disease agent, in eastern United States. The American Journal of Tropical Medicine and Hygiene, 86(2), 320–327. https://doi.org/10.4269/ajtmh.2012.11-0395
- Stromdahl, E. Y., & Hickling, G. J. (2012). Beyond Lyme: Aetiology of tick-borne human diseases with emphasis on the south-eastern United States. Zoonoses and Public Health, 59(Supplement 2), 48–64. https://doi.org/10.1111/j.1863-2378.2012.01475.x
- U.S. Census Bureau. (2024). Population and housing unit estimates tables. Retrieved July 1, 2024, from www.census.gov/programs-surveys/popest/data/tables.All.html